29 January 2011

How Much of Home Field Advantage is Due to Strike Zone Bias? @ BtB

A new Freakonomics-style book called Scorecasting takes a statistical look at common myths and perceptions in sports. One of these is the case of home field advantage. In their work, they claim that most of home field advantage is the result of favorable officiating. While I don't dispute this, and tend to agree with the general premise, they go on to argue that home plate umpiring is a significant component of home field advantage in baseball.

This is just plain wrong, and the people who do this work with some frequency (including myself, but also fellow sabremetricians such as Dan Turkenkopf, Mike Fast and Phil Birnbaum) know that it's wrong. How do we know? Because we've already crunched the numbers and found them practically insignificant.

See below my analysis of this purported effect:

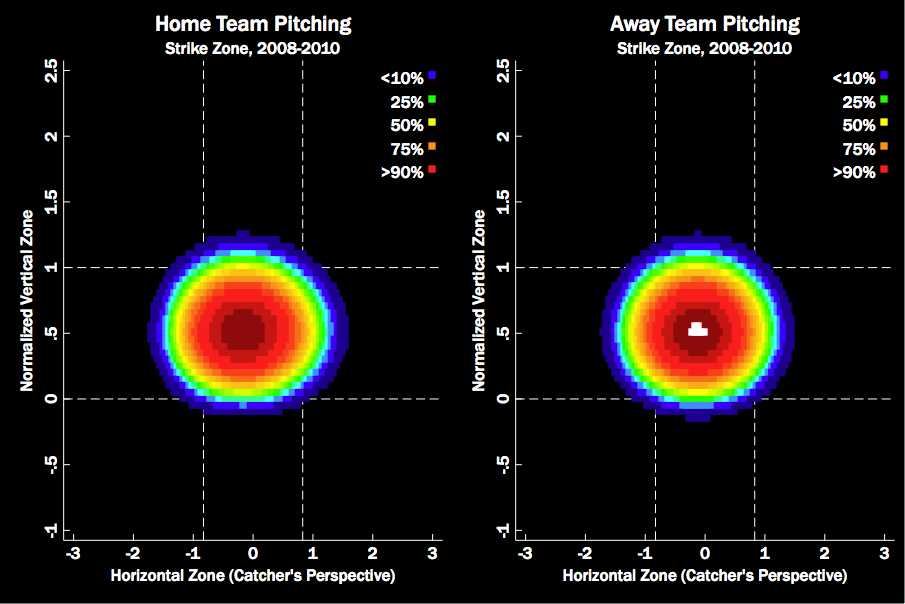
I assigned a run value to each "blown" call thrown during the regular season from 2008-2010... I find the home vs. away spread to be -0.119, or about +/- 0.06 runs, per 150 called pitches (equivalent to the average nine-inning game)... Considering that the run environment over this period is about 9.1 per game... home team bias in the strike zone only accounts for ~16% of the observed effect... For those of you scoring at home, that advantage is equivalent to playing an entire season at home and barely winning one extra game.
Continue reading at Beyond the Box Score...

19 January 2011

MLB Ballpark Seating Capacities 1920-2010 @ BtB

I continue my look at stadium construction trends over at Beyond the Box Score:

MLB park capacities reached their peak in 1993 at a high mean of 52,889. Average capacities would have peaked at an earlier date if it weren't for the expansion Colorado Rockies playing at cavernous Mile High Stadium in their inaugural season.
Continue reading at Beyond the Box Score…

18 January 2011

Stadium Construction Trends in Baseball and Football

A short time ago, I authored a post at Beyond the Box Score about stadium construction trends in Major League Baseball. As promised, here's Part II of the series, focusing on pro football.


In this case, I started in 1940 in order to weed out (most of) the defunct NFL teams from the sport's early years, as well as some of the early sandlot fields for which it was near-impossible to uncover construction dates. Any remaining defunct teams are absent from the database. As with the last study, I counted shared stadiums only once.

There are some interesting parallels and contrasts between MLB and NFL/AFL stadium trends. Both sports exhibit two distinct construction booms, including an expansion-era boom during 1960-1975 and a modern boom 1995-present. But first, some fun facts:
  • The average AFL/NFL stadium reached its peak age at the start of both the 1957 and 1958 seasons, at a mean of 36.4 years.
  • As the NFL expansion era wrapped up in the mid-1970s, the average NFL stadium reached it's youngest point at 15.4 years of age in both 1975 and 1976.
  • In the post-expansion years, stadium ages peaked again in 1991 and 1992 at a mean of 26.7 years. The latest wave of stadium construction drove that figure quickly down to post-expansion low of 15.5 years in 2003.
  • That last wave of construction drove the average age down at a rate of nearly 1 year per season.
  • The largest single-season "rejuvenation" took place from 1970-71. As Dallas, Philadelphia and New England all moved into brand-new stadia, and both Chicago and San Francisco moved into slightly newer facilities, the average age dropped by 7.5 years. Five seasons later, the average dropped by 5.0 years when Detroit, New Orleans and the NY Giants all relocated.
  • The biggest single-season jump in age--a whopping 5.2 years--took place between 1941 and 1942, thanks to Philadelphia's flip-flopping between Shibe Park and a relatively new Philadelphia Municipal Stadium, and the (then) Cleveland Rams' similar vacillations between Cleveland Municipal Stadium and League Park.
As to compare NFL and MLB data, let's revisit the chart from Part I:

12 January 2011

Benefit of the Doubt: Fuzzy Corners @ BtB

My latest at BtB:


While some sources of umpire error are rather confounding, some are far more intuitive. Take, for instance, the distance between the umpire's eye and the location of a pitch. Umpires tend to position themselves over the inside part of the plate (this provides more protection from batted balls), putting themselves at a disadvantage when calling outside pitches.
We witness the same effect when it comes to the height of the pitch: the farther away from the ump's eye when the pitch crosses the plate, the more likely the umpire will make a call that is inconsistent with that of the Pitch F/X system.
Continue reading at Beyond the Box Score…

10 January 2011

Benefit of the Doubt: The Cruel Umpire @ BtB

As opposed to last week's approach, this episode looked at how the zone actually gets worse for the pitcher as the run expectancy of the inning increases.


Out states are represented by color, while the base state is represented as text (bases empty = ___ ; runners at the corners = x_x ; bases loaded = xxx). As you can see, the relationship is nearly the perfect inverse of the one we observe with ball-strike count. As the run value of the base-out state increases, the zone actually becomes less favorable to the pitcher; the umpire is cruel instead of compassionate.
Continue reading at Beyond the Box Score...

05 January 2011

The Twin Is In!


Bert Blyleven, the long-snubbed Minnesota Twin (and Ranger, and Indian, and Pirate, and Angel) finally won induction to the Major League Baseball Hall of Fame in his 14th year of eligibility.

At the risk of blowing this out of proportion, this is an inexcusable wrong that has finally been righted. Blyleven is a slam dunk from both sabremetric and traditional perspectives.

The durable, baffling starter finished in the top 10 for ERA in 10 seasons, pitched the 14th most innings in MLB history (including #1 in '85 and '86), recorded the 5th most strikeouts in MLB history (finishing in the top 10 in 15 different seasons, leading the pack in 1985), finished 9th on the all-time shutouts list, led the league in shutouts in 1973, 1985 and 1989, and—for what it's worth—recorded 287 wins.

From an advanced stats standpoint, Blyleven recorded a career 87.6 wins above replacement (good for 43rd of all time) with a pitching WAR of 90.1 (good for 13th all time!), finished top 10 in WHIP 11 times (leading the pack in 1977), finished top 10 in K/9 on 14 separate occasions, finished top 10 in K/BB an astonishing 16 times including three seasons ('71, '73, '86) when he beat the field, finished top 10 in ERA+ in 12 different seasons (finishing #1 in 1973), finished 12th all time in base-out runs saved, and 26th all time in win probability added.

Congratulations, Bert. Welcome to the Coop!

Oh, and also Robbie Alomar.

(All data from Baseball-Reference.com. Photo Credit: Twins Dugout)

04 January 2011

Stadium Boom Amounts to Fountain of Youth for MLB Parks (@ BtB)

This is the Part I of my two-part visualization of ballpark construction in MLB and the NFL. The NFL post will be strictly Rational Pastime property. For now, however, enjoy:

In 1960, the final season before expansion, the average MLB ballpark was 37.3 years old. In 1977, the final season of the expansion wave, the average age sat at just 20.8 years: a drop of 16.5 years of age—nearly one year per season.
Continue reading at Beyond the Box Score...